Support & Resitance LinesIntroduction:
Support & Resistance levels are time consuming to mark on charts. They also must be maintained. If the user has multiple charts they analyze, this adds to the workload. This indicator attempts to automate that work flow for the user.
Description:
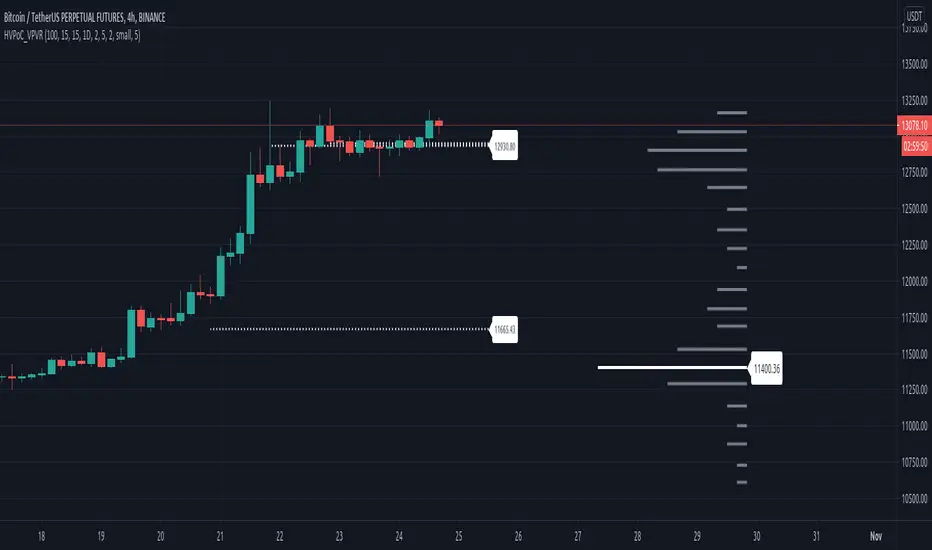
Psychological Support and Resistances
are marked with a horizontal ray and labeled.
Levels marked include the 1 Month, 1 Week, and the Daily.
If a candle closes on the marked levels, the horizontal ray marking that level will disappear.
Volume Based Support and Resistances [/i
With the fixed range volume profile tool, marked levels include the point of control(POC) and the Value Areas (VA). This includes both the Value Area Low (VAL) and the Value Area High (VAH). Levels marked include the 1 Year, 6 Month, and the 1 Month fixed range volume profile.
If a candle closes on the marked levels, the horizontal ray marking that level will disappear.
How to use:
1) Turn on indicator and make sure you are on the 1D time frame.
2) Find areas of high confluence and mark with rectangular box.
3) Once all areas are marked, turn off indicator to save CPU time.
4) It is now ready to use and you can scan the chart using multiple time frames.
Useful Tips:
1) Use this tool to see if these levels marked are respected in forward testing.
2) You can turn off labels and color code horizontal rays to make tool run more efficiently for the CPU.
3) Use RSI, MACD, Wave Trend with Crosses , or any other oscillator to identify divergences once price hits support & resistance. Observe if price reacts.
4) Confluence is key, the higher the confluence, the better.
Chỉ báo Pine Script®